Discrete vs Continuous data: Know with Examples


Table of Content
As all teachers say, studying math is important. It is a sub-set of philosophy that concerns itself with solving problems. Logic and pragmatism plays a central role in math. Through logic, it aims to describe or understand the consequences of a set of assumptions. In layman terms, math at its simplest is humanity's best bet at understanding the universe. Statistics is an important part of math. This blog provides relevant information about discrete vs continuous variables.
Read more about statistics and continuous and discrete variables below.
What Is Statistics? A Brief Overview
As we all know, statistics is the branch of mathematics that deals only with data. It involves collection, classification, presentation and interpretation of data. This definition can often be misleading because we are dealing with data. But statistics is much more than that. It involves using mathematical techniques. Some of these techniques are:
- Collection: Involves the question to answer, the sample group picked, and so on.
- Classification: This is the grouping of data into various classes.
- Presentation: The presentation of data in pictorial or graphical formats.
- Interpretation: To make inferences based on the data collected. This provides information to make decisions.
Statistics can add credibility to any argument. It makes the notion sound more authentic since it seems backed by numbers. Thus, it is often used to lie and mislead people. Understanding statistics gives you the ability to understand and interpret any such claims.
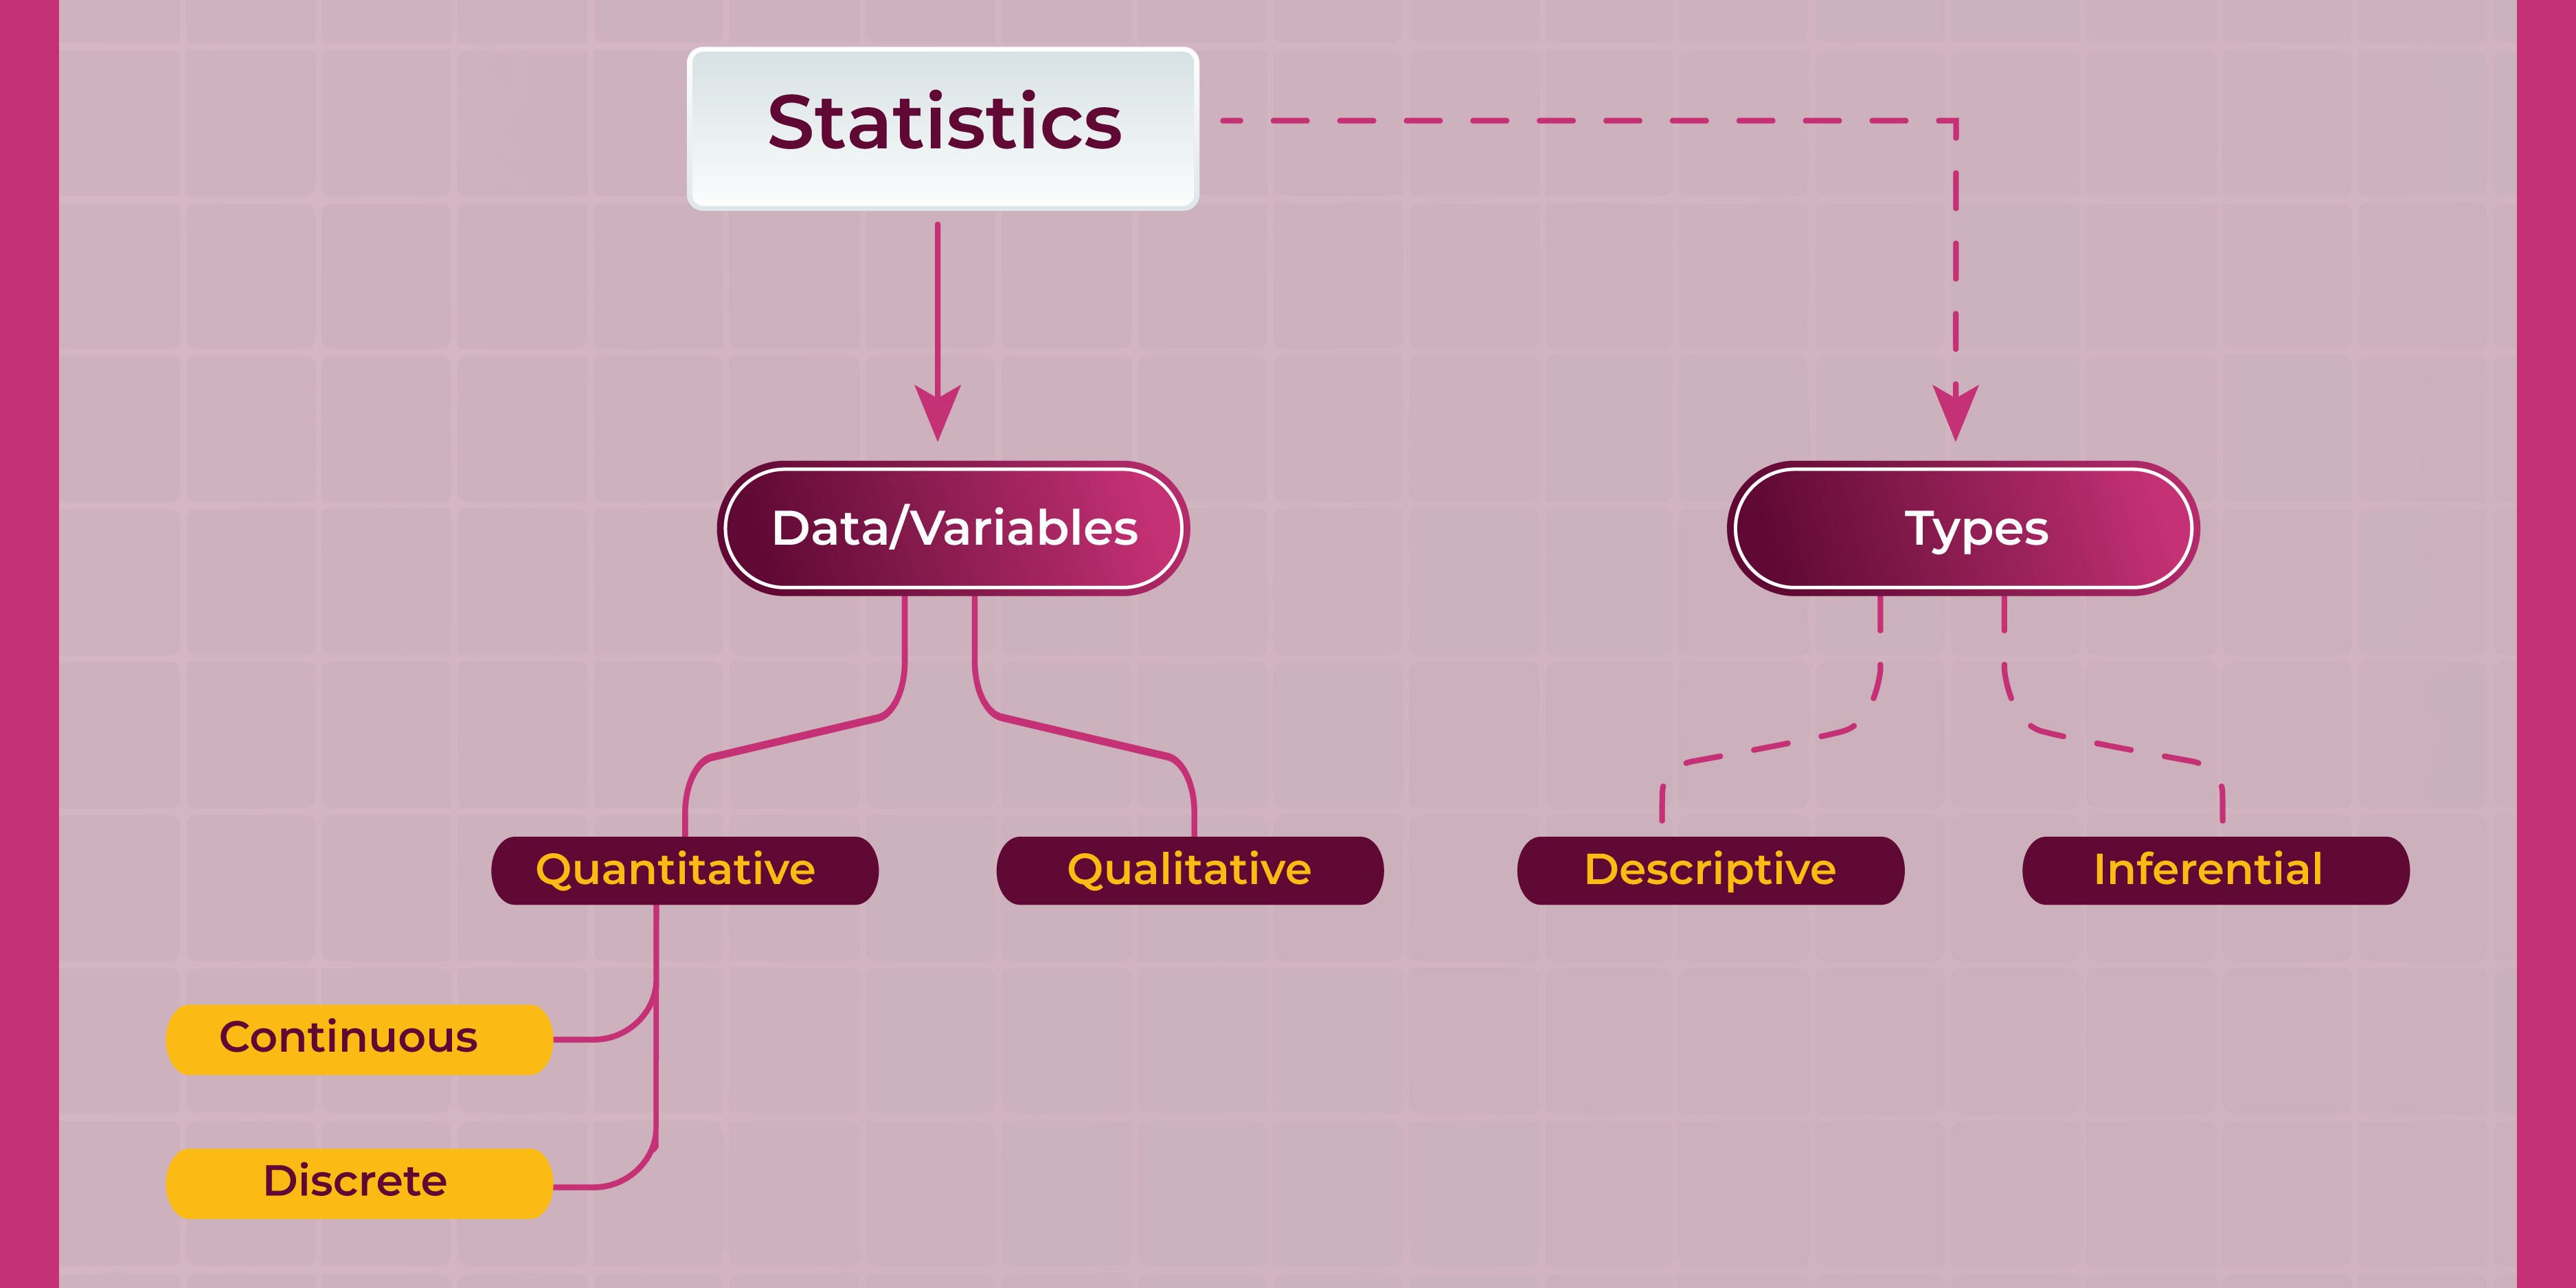
Two important forms of statistics are descriptive and inferential. The organization and summarizing of data are descriptive statistics. Whereas, the formal methods of concluding information comes under inferential statistics.
As you might have noticed, we have used data and information in distinct places. These two terms are an integral part of statistical analysis. More about data and its various types below.
Introduction To Data Types
Before discussing data types, we must know what is data. Data is raw and not useful for making interpretations. Whereas, information specific and processed. Interpretations or inferences are a by-product of information.
Data types are classifications which specify the kind or nature of data a variable holds. It also includes their manipulation. Understanding these are fundamental. They control the storing, processing and analysis of information. Students can often have difficulty in understanding this topic, which might be the reason why they search for maths homework help.
One other such term is variable. It is any characteristic or value that is either measurable or countable. There are various classifications of variables, which are as follows:
- Qualitative Data: These are descriptive categories or categorical data. They are an observed phenomenon. They can be either nominal (with no inherent order), and ordinal (with some natural order)
- Quantitative Data: These are numerical measurements. These can be either in a continuous or discrete form.
There are independent and dependent variables, control and confounding variables, and many more. Before we talk about discrete vs continuous variables, the paragraph below discusses continuous variables.
What is Continuous Data in Statistics?
Data analysis needs one to have proper understanding of different types of variables. One such quantitative variable type is the continuous one. This is the kind of data that contains values that might fall in a specified range.
Definition And Characteristics
It is a variable whose value can be any number within a given interval. Simply put, this is a range-based data collection. One can also consider it to be the type of variables that are measurable but not counted. Some important characteristics of continuous data are:
- Measurable: Measured, rather than counted. The accuracy of the measurement is dependent on the instruments used.
- Fractional/Decimal values: Can be in fractional or decimal form, thus are accurate.
- Infinite Possible Values: Range-based, infinite values exist which the variable can assume.
- Continuum-based: Exist in a continuous, unbroken form without any gaps or interruptions.
We have discussed what continuous variables mean, and their key characteristics. But, to leave no room for doubt, here are some examples:
Examples Of Continuous Variables
Many real-world phenomena are best represented by continuous variables, for example:
- Income: Can exist within a specified range.
- Weight: Can take on a range of values
- Temperature: Varies continuously
- Time: The duration of any event is specified within two points, that is, a range.
- Height: can exist within any two points in a range
- Distance: Is measured by taking starting and ending points, in a range.
- Speed: Is any value within the possible range.
These were some common examples of continuous variables. Moreover, the next section talks about their various use cases.
Use Cases Of Continuous Data
These are versatile and have many real-world applications across many fields, as the table will show.
|
Field |
|
Explanation |
|
Scientific Research |
Measuring Natural Phenomena |
Many natural events are best represented through continuous variables like temperature variations, pollution levels, geological changes etc. |
|
Medicine |
Monitoring patient health and evaluating treatments makes use of continuous variables |
|
|
Manufacturing |
Quality Control |
Continuous variables are important as they ensure quality is measured accurately |
|
Performance analysis |
Variables like speed, force, torque etc are all continuous, and hence, their efficiency is measured through continuous variables. |
|
|
Finance |
Modeling |
Stock prices, interest rates, inflation rates are all continuous variables |
|
Economic Indicators |
Indicators like GDP, unemployment rate, consumer price index are continuous as well |
|
|
Environmental |
Climate Science |
Temperature, rainfall, wind speed are continuous variables |
|
Pollution Control |
Monitoring continuous variables such as air and water pollutant concentrations is important |
|
|
Daily Life |
Automation |
Modern sensor technology measures parameters (temperature, speed, light etc) continuously |
|
Visualization |
Continuous data is visualized using line graphs, scatter plots, histograms etc. |
Thus, as seen in the table above, continuous variables are common in statistics. The other quantitative data type we are to discuss is the discrete one. The next section targets discrete data examples and use cases.
What is Discrete Data in Statistics?
This data type is also fundamental to the field of statistics and data analytics. This section aims to provide information on its definition and characteristics. It also discusses various real-world use cases. For this very reason, students seek statistics assignment help.
Definition and Characteristics
It only takes on a finite, countable number of distinct values. The sets of data are also viewed as distinct. These are typically whole numbers and depict the count of items or events. Some common characteristics of discrete data include:
- Countable values: The values are finite and countable even if large.
- Integers (usually): Values are usually whole numbers or integers since counted.
- No intermediaries: Not range-based, hence values do not fall between two adjacent values.
- Distinct: Each variable is distinct and separate from others.
Example of Discrete Variable
Now that we have discussed the definition and key characteristics of discrete variables, here are some examples of discrete variable :
- The number of students in a class is a fixed number. There can be 25, 30 or 42 students but not 25.5.
- Cars owned by a household can be either 0, 1, 2 or any finite number. It's impossible to own a fraction of a car.
- Occurrences of tails in coin flips: when flipping a coin many times, the count of tails obtained would be a discrete value.
- Goals scored in a soccer match: a soccer team can only score a countable value.
The points above showcased some common examples of discrete data. They can be extremely helpful for students looking for expert help.
Stuck on a hard Math Assignment?
Say no more! Avail our service and be at ease.
Help with Maths assignmentUse Cases of Discrete Data
In the table below, some common use cases of discrete data are presented.
|
Field |
|
Explanation |
|
Frequency Analysis |
Market Research |
number of customers buying a particular product, number of website visits per day, or the number of respondents |
|
Demographics |
Involves the counting of number of individuals in an age group, number of households etc. |
|
|
Categorical analysis |
Customer Segmentation |
Customers are divided into categories based on purchase history, and this is in the form of discrete values |
|
Species Identification |
In biology organisms are classified into various species based on discrete characteristics. Counting the presence or absence of various features helps in taxonomic classification. |
|
| Event or Occurrence Tracking |
Crime Statistics |
Counting of number of report crimes in different categories (theft, assault, burglary) provides important data for the law enforcement. The count of such events exists as a finite number |
|
Traffic Management |
The vote count for any candidate in an election is a discrete number. A vote cannot be a decimal number. |
|
|
Surveys |
Public Opinion |
Public opinion surveys require the respondent to choose from a set of predefined finite options. This generates discrete data reflecting the public sentiment. |
|
Experimental Design |
Counting Outcomes |
In experiments, the number of successes or failures exist as a discrete finite number. The analysis of this discrete data allows the drawing of conclusions about the effects of the experiment. |
|
Genetics |
Counting the number of offspring with a specific genetic trait (in the context of a genetic experiment) results in discrete data which is then used to study inheritance patterns. |
As we saw, discrete data or variables are fairly common in research and day-to-day life. Whatever exists in a discrete, countable format, is thus treated the same way in statistical analysis. Now that the definition and key characteristics between the two are known, the question of how they're different becomes crucial to answer. The section below aims to shed light on the difference between continuous and discrete variables.
Discrete vs Continuous Data:Detailed Comparison
In the field of statistics, both continuous and discrete variables are fundamental. Although both deal with numerical data, they are quite different in their approach. The section below describes their differences, different visualization techniques, and statistical analysis methods.
Difference between Discrete Data and Continous Data
Some major differences exist between continuous and discrete variables. The table below talks about discrete vs continuous data in detail:
|
Factor |
Continuous |
Discrete |
|
Definition |
These variables exist within a specified range. |
These variables do not exist between any two adjacent values or ranges and exist as specific values |
|
Nature |
Measurable |
Countable |
|
Accuracy |
Highly accurate, use decimal values and fractions |
Not as accurate. Mostly integer values are used |
|
Visualization |
Represented by line graphs or curves and box-whisker plots since they are continuous |
Represented by bar graphs, pie charts, since values are finite or discrete |
|
Probability Distributions |
Have probability density functions |
Have Probability mass functions |
|
Common Statistical methods |
T-tests, ANOVA, Regression analysis are some methods used for continuous variables |
Chi-square tests, Binomial tests, Non-parametric tests are used for discrete variables |
The above table discussed the key differences between continuous and discrete variables. Continuous are measurable, and discrete countable.
- Another difference is their atomicity. It refers to whether the value referred to is dividable or not. Discrete variables are atomic and undividable. But, continuous variables can decompose into any number of values. At least within the specified range.
- Based on granularity, continuous data is accurate. But, its not same for discrete data because it has limited precision.
The table also mentioned visualization and statistical methods. Now the section below focuses on elaborating on these two important topics.
Visualization Techniques
The visualization techniques differ with the type of data. For continuous variables, it is important to understand the distribution, central tendency of data and of course, relationships with other variables.
Some visualization techniques for continuous variables are:
- Line graphs: These are ideal for displaying trends over time. Or relationships between any two variables where one of them is ordered. Visually depicts the continuous flow of data.
- Box and Whisker plots: Helpful in providing a summarized view of continuous variables. This type of plot shows the median and outliers.
- For discrete variables, the focus is more on the count or amount of the category rather than the distribution or a central tendency. Visualization techniques for discrete variables are:
- Bar graphs: This is the most common way to showcase discrete data, each bar corresponds to its category. The height of the bar represents the proportion or the value of that category.
- Pie charts: Shows the proportion of each category as a fraction or a slice of the circle.
These were some techniques used to visually portray the two types of variables. Another important thing to discuss now, is statistical analysis. Moreover, the various statistical analysis methods used for continuous and discrete variables. The section below discusses these methods briefly.
Statistical Analysis Methods
As far as statistical analyses go, the methods for working with the two types of variables are different. For continuous variables, the following statistical analysis methods are useful:
- The calculation of measures of central tendency like mean and median. Also, standard deviation, variance, range, etc.
- Inferential Statistics methods like T-tests, analysis of variance, regression and correlation analysis and time-series analysis.
- Now, for discrete variables, since the context is categorical, the following methods are preferred:
- Frequencies, proportions, percentages and modes are useful for working with discrete variables
- Methods of inferential statistics like chi-square tests, binomial tests, and Poisson regression are all quite effective at working with discrete data.
Now that statistical methods are known, there is a need to discuss about the various tools and technologies used. The section below provides relevant information on the various technology used. Students confused about this often look up various assignment writing services.
Tools Used
The tools used for discrete and continuous variables are fairly similar and often overlap, but the way they're used is different.
|
Software/Technology |
Continuous |
Discrete |
|
Spreadsheets |
Creating basic graphs like line graphs, box and whisker plots, and others |
Useful for creating bar graphs, pie charts, frequency tables. |
|
Python, R, SPSS |
Extremely capable at working with and visualizing continuous variables, especially for doing regression analysis |
Various tools for creating bar charts, chi-square tests, binomial tests,etc. |
|
PowerBI, Tableau |
Helpful in creating dashboards with histograms and other plots |
Can be used to build interactive pie-charts, maps |
Thus, we saw that continuous and discrete variables differ by a lot. Various visualization techniques, statistical analyses methods were also discussed. This information is really important for a student of statistics and mathematics. Especially those for whom being a data analyst is a career aspiration.
How Our Math Experts Help With Your Math Work
Statistics play a critical role in the field of mathematics and thus, are to be considered as such. It involves working with data. We did an in-depth study of various aspects of statistics, of the variable types. We saw that continuous variables exist within a range, and are measurable. Discrete are counted and do not exist within a range. The section on discrete vs continuous data explained their differences. We also saw the various visualization and statistical methods for the two. Moreover, the software tools used for working with them.
While learning this is important, students can often feel burdened by the weight of working on their assignments. They especially felt unable to find the difference between continuous and discrete variables. This blog is exceptionally useful for such students. However, if they still have any more doubts, our experts at Instant Assignment Help are always here assist them.
Know More: Permutations vs Combinations | Defintion, Formulas, Difference & Examples
Was This Blog Helpful?


Frequently Asked Questions
- What is statistics?
Statistics is an important branch of mathematics that deals with the collection, preparation, classification and interpretation of data. The study of statistics is helpful in providing insights on data. - How does context affect transforming data into information?
In statistics, data refers to the raw facts and figures collected. It does not provide relevant insight. Whereas, information is processed data, which can be easily used to make inferences.
- What is the difference between continuous and discrete data?
Continuous data exists in a range, and is measured. In the case of discrete data, it exists as separate distinct value, and is countable. This is the core difference between the two data types. - State some common technologies and tools used in statistics.
Some common software tools associated with statistical analysis are: - Spreadsheeting software: Tools like MS Office are useful in working with data and visualization.
- Programming languages like R and Python are extremely capable of data analysis.
- PowerBI, Tableau: Allow the creation of interactive dashboards.


Get 5% Cashback
On App - Grab it while it lasts!

Download app now (or) Scan the QR code


Login / Sign up
Get Your Free Dissertation Outline NOW !Congratulations!
Check Your Registered Mail for download

- Plagiarism
- Pricing
- Order Now
- Call Back